Market Internals
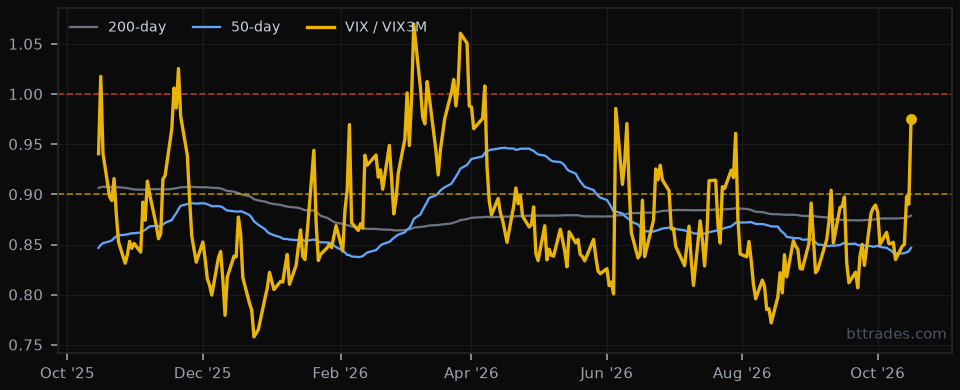
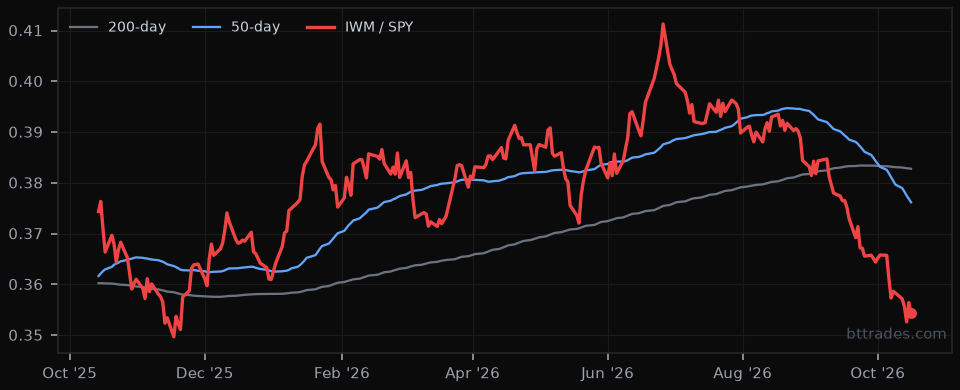
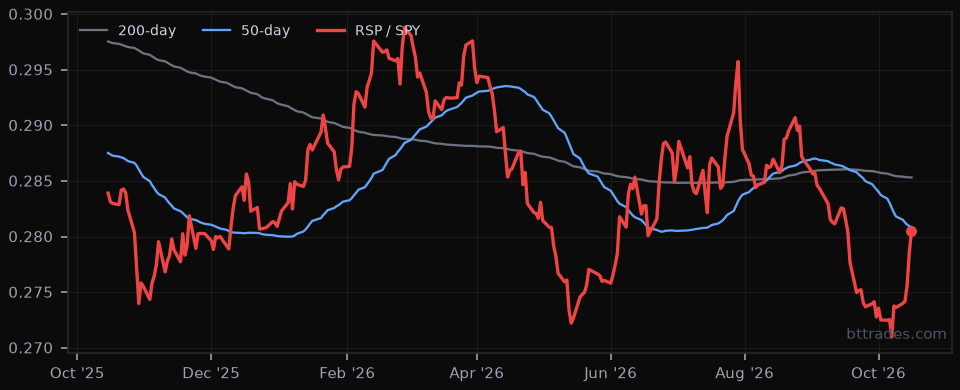
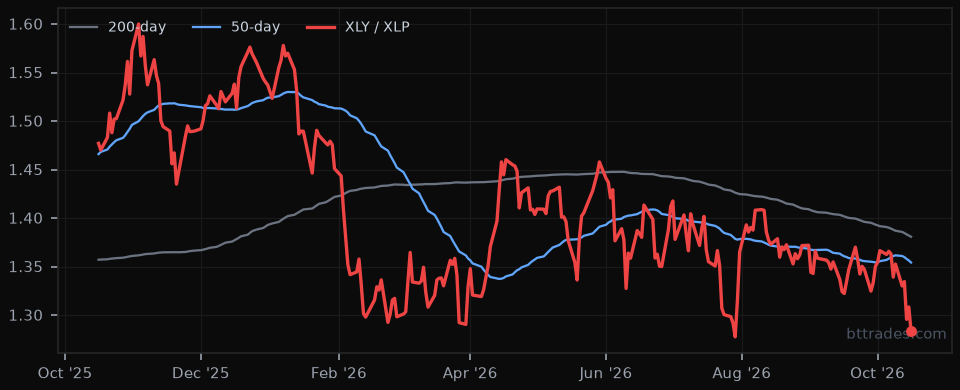
Internals read Neutral this week, with 5 green, 7 yellow and 4 red. Equity internals are the weak spot, with small caps, breadth (equal-weight) and discretionary vs staples red (a narrow, defensive tape), and the 10-year yield is red too. Holding up: copper/gold, gold vs the dollar, bitcoin, stocks vs long bonds and the 2s10s curve. With VIX at 20.0, VIX/VIX3M at 0.98 and high-yield spreads at 3.23%, volatility is elevated but not panicked, and credit is the tell to watch: a move to red there would tip the regime.
Sector Rotation (Weekly) Updated Sun Oct 11, 2026 · weekly
Relative strength of the 11 SPDR sectors plus theme and size ETFs versus SPY. Leading, weakening, lagging and improving quadrants; tails show 5 sessions earlier.

Tap a category to see its indicators and charts.
CreditMixed0G3Y0Ravg +0.00
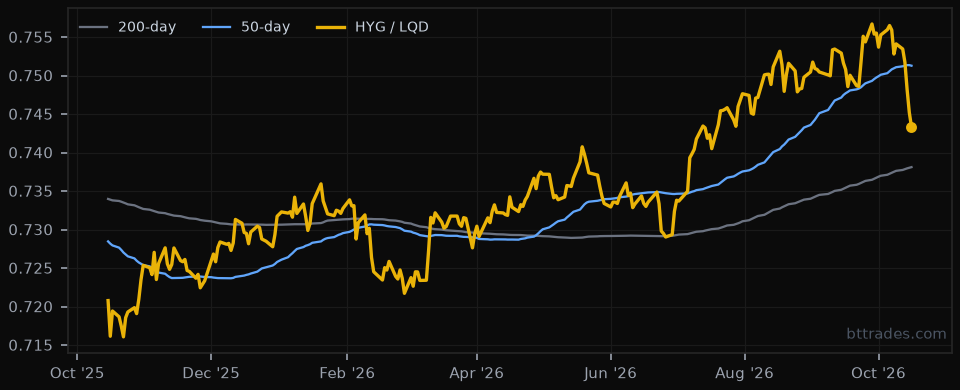
HYG / LQDyellow
Junk vs investment grade is mixed, so credit is not confirming either way (below its 50-day, 50-day above 200-day, -1.4% on the week).
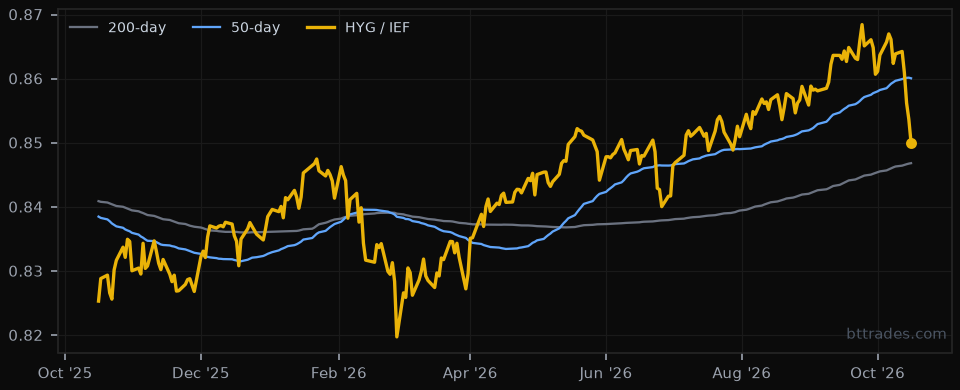
HYG / IEFyellow
Junk vs Treasuries is mixed; watch for a break lower (below its 50-day, 50-day above 200-day, -1.6% on the week).
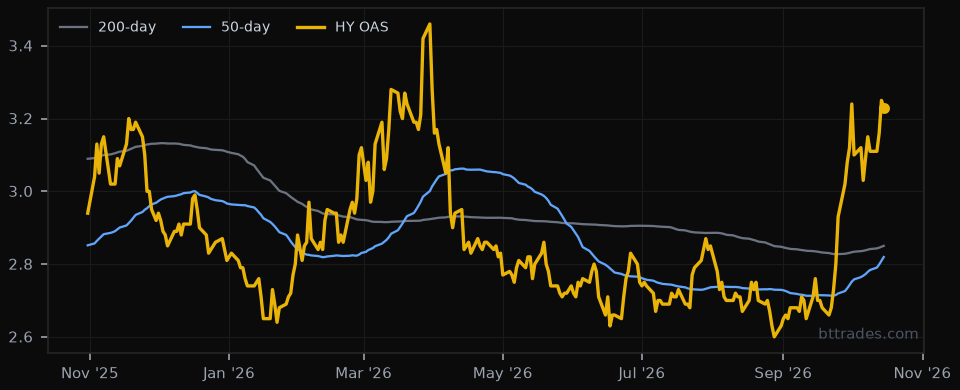
HY OAS (FRED)yellow
High-yield spread 3.23% (+8 bp on the week); spreads drifting, not a stress signal yet.
VolatilityMixed0G2Y0Ravg +0.00
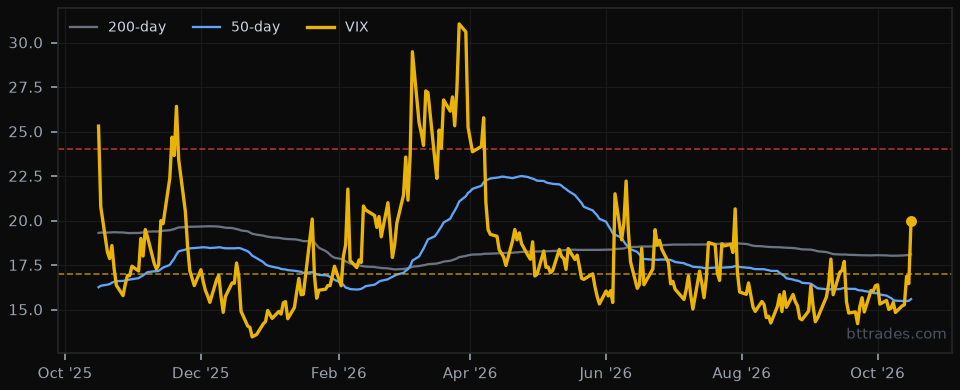
VIXyellow
VIX 20.0 (+35% on the week): elevated, in the 17–24 caution zone.
VIX / VIX3Myellow
Term structure 0.98: curve flattening toward 1.0, near-term fear is building.
Equity InternalsWeak0G1Y3Ravg -0.75
IWM / SPYred
Small caps lagging: appetite is narrow and defensive.
RSP / SPYred
Cap-weight beating equal-weight: a narrow, top-heavy market.
XLY / XLPred
Staples beating discretionary: money rotating to defense.
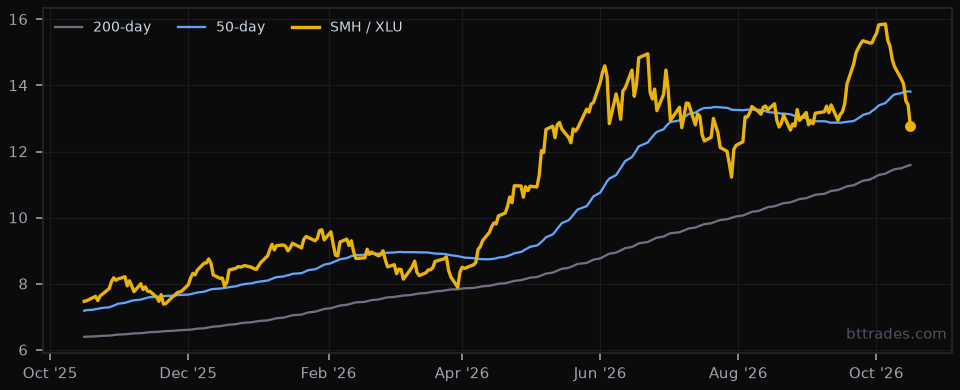
SMH / XLUyellow
Chips vs utilities is mixed; leadership is wobbling (below its 50-day, 50-day above 200-day, -12.2% on the week).
Cross-AssetHealthy4G1Y0Ravg +0.80
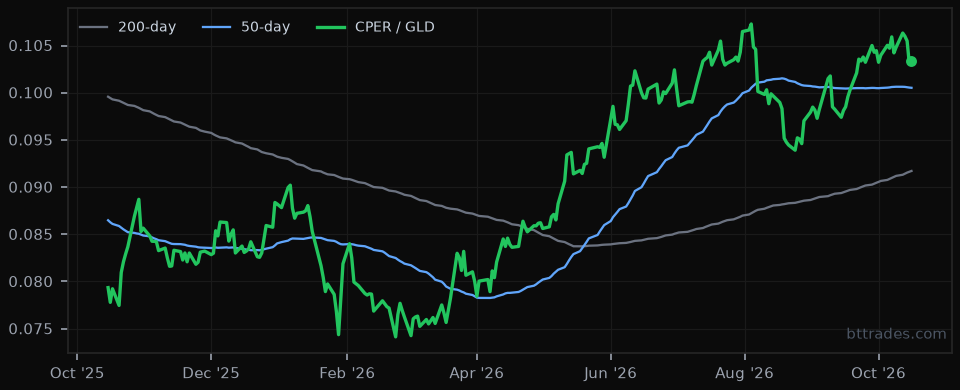
CPER / GLD (copper/gold)green
Copper beating gold: growth optimism.
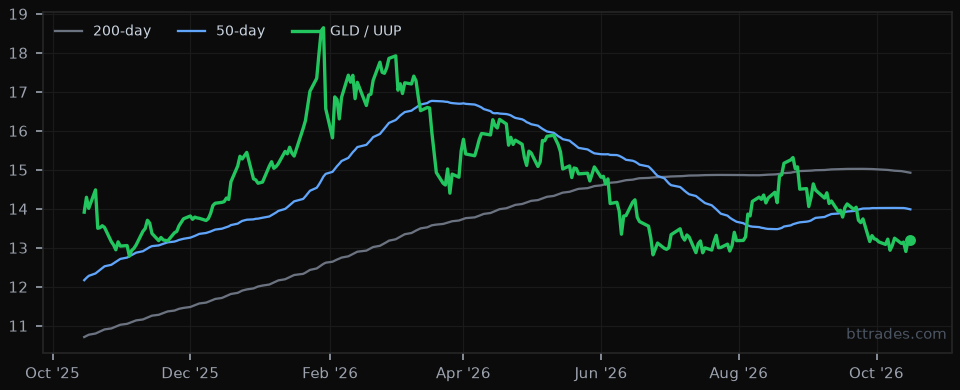
GLD / UUP (gold vs dollar)green
Gold not outrunning the dollar: no hedging scramble.
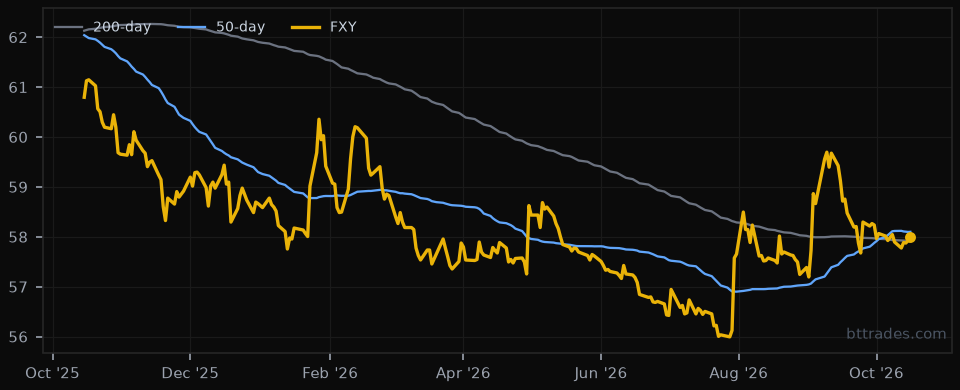
FXY (Japanese yen)yellow
Yen trend is mixed; watch for a sharp pop (below its 50-day, 50-day above 200-day, +0.2% on the week).
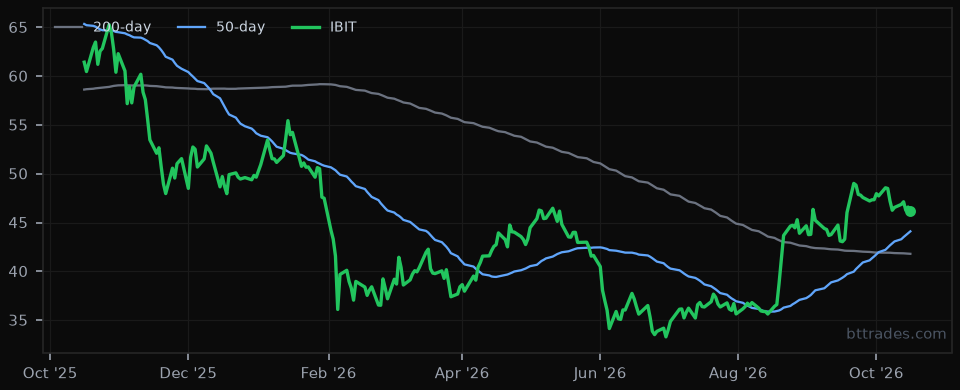
IBIT (bitcoin)green
Bitcoin trending up: speculative appetite is alive.
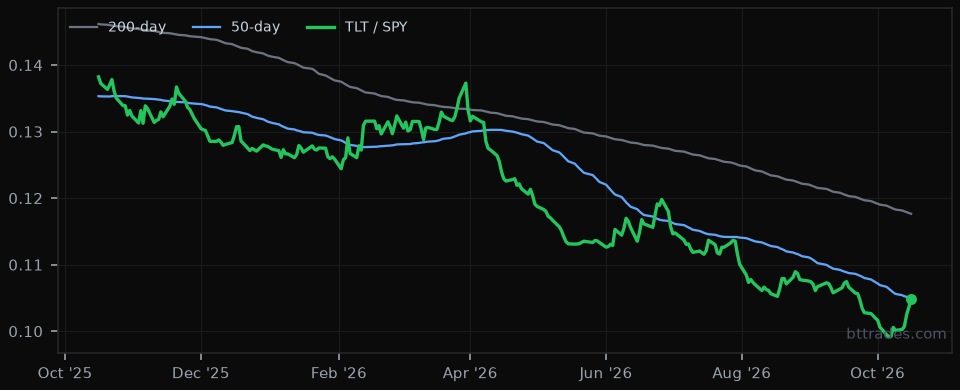
TLT / SPY (flight to safety)green
Stocks beating long bonds: no flight to safety.
Rates & MacroMixed1G0Y1Ravg +0.00
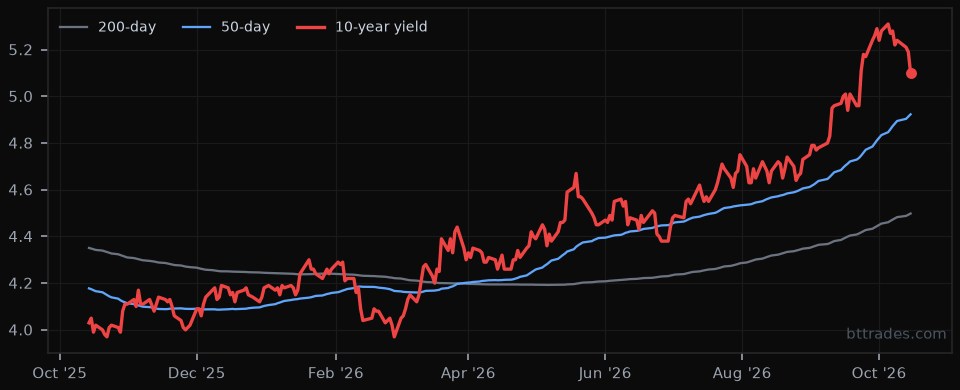
10-year yield (FRED)red
10-year 5.10% (-12 bp week, +16 bp in 4 weeks): up fast and above the 200-day, a headwind for valuations despite this week's dip.
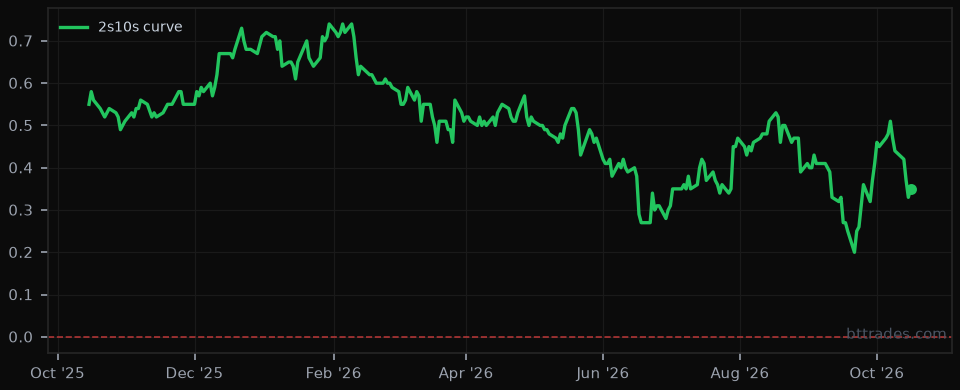
2s10s curve (FRED)green
10y minus 2y +35 bp (-9 bp week): positively sloped, no inversion warning.
How we score
Trend indicators are green when the line is above its 50-day average and the 50-day is above the 200-day (flipped for risk-off gauges like TLT/SPY, yen, gold/dollar, HY spreads), red when both are the other way, and yellow when mixed. VIX: under 17 green, 17–24 yellow, above 24 red. VIX/VIX3M: under 0.90 green, 0.90–1.00 yellow, above 1.00 red. 10-year: green below its 50-day, red when above its 200-day and up more than 15 bp in 4 weeks. 2s10s: inverted red, under +25 bp yellow. Regime = greens minus reds. Category badges: each indicator scores green +1, yellow 0, red −1; a category averaging above +0.33 is green (Healthy), below −0.33 red (Weak), otherwise yellow (Mixed). Tap a category to open its charts. Data: Tradier daily closes; FRED (DGS10, T10Y2Y, BAMLH0A0HYM2). Charts show 1 year of daily data. Updated Sat Oct 17, 2026 5:25 PM ET.